You launch a Meta campaign, see clicks arriving, watch conversions accumulate, and feel the account finally moving. Then the invoice, product costs, fees, refunds, and fulfilment expenses land, and the excitement disappears. The dashboard says “growth,” but the bank account says the campaign needs another look.
That gap is why ROI for Facebook ads can't be reduced to a single Ads Manager column. Profitable buying depends on creative volume, audience temperature, attribution quality, and the economics behind every sale. The current benchmark picture is encouraging, but it only helps when you connect platform performance to contribution margin.
Why a Healthy-Looking Campaign Can Still Lose Money
A media buyer refreshes a creative, sees link clicks climb, and watches purchases appear in the reporting window. The update goes to the founder, the budget increases, and the account looks ready to scale. Then product costs, payment fees, fulfilment, returns, and creative expenses are deducted. The orders generated activity, but they may not have generated profit.
That gap is a decision problem as much as a measurement problem. Clicks measure response to an ad, not the value of the customers who respond. Conversions confirm that people completed an action, yet they do not show whether the selling price covers product cost, payment fees, fulfilment, returns, creative production, and advertising.
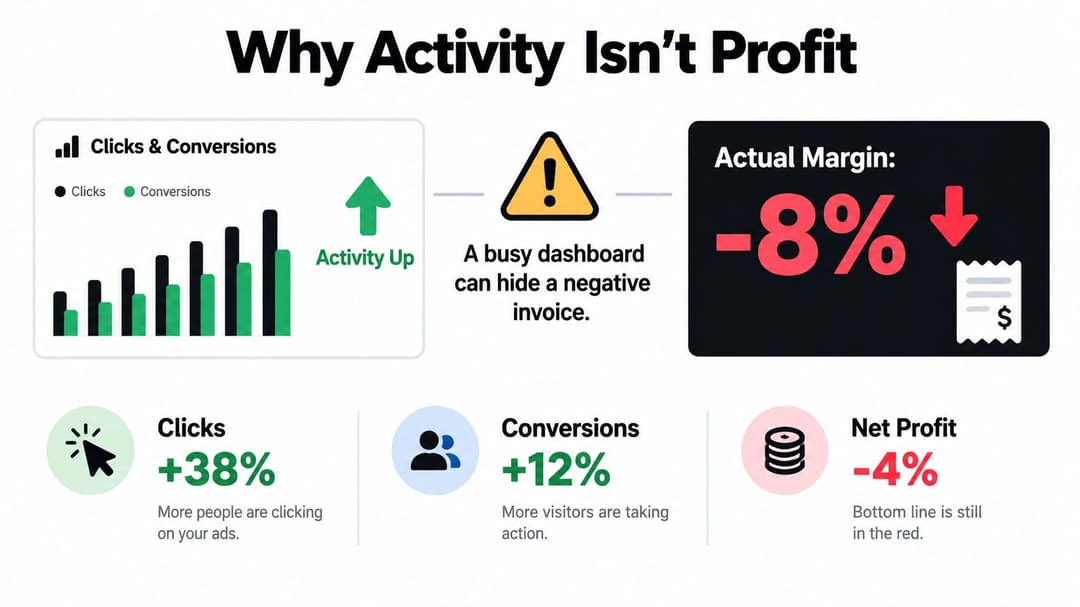
Why dashboard activity creates false confidence
A creative refresh can bring in more traffic because the hook is stronger. It can also attract low-intent users who click from curiosity. If the landing page or offer does not turn those visitors into profitable customers, cheaper traffic remains expensive.
Creative testing volume matters here. More variations can improve click efficiency, but a winning hook is not automatically a profitable acquisition system. Check whether the new creative attracts prospects who buy at a contribution margin that supports the required ad cost.
Audience temperature creates another blind spot. Retargeting may produce a strong return while prospecting loses money. A blended account figure combines those groups, creating a reassuring average and hiding whether the problem sits with the audience, offer, creative, or budget allocation.
Practical rule: Treat every top-line metric as a diagnostic clue, not a profit statement.
The numbers that deserve attention
Read the metrics in sequence instead of judging ROAS alone:
- CPM: Shows the cost of reaching the auction. A rising CPM may reflect competition, audience limits, or weak ad quality. It does not prove the campaign is unprofitable.
- CTR: Shows whether the creative earns attention and qualified clicks. Weak CTR often points to the message, visual, offer framing, or audience fit.
- CPC: Connects auction cost with click rate. Strong creative can lower click costs, but inexpensive clicks have no value if they do not become profitable customers.
- CPA: Measures the cost of the conversion event. Compare it with contribution profit per order, not revenue alone.
- ROAS: Shows attributed revenue divided by ad spend. It helps compare campaigns, while excluding costs that determine actual profit.
- Contribution margin: Shows what remains after variable costs and advertising. Use it to decide whether additional spend can support profitable growth.
Automation can surface these changes quickly, but it cannot decide whether a low-cost prospect is worth acquiring without reliable margin inputs. A campaign can grow revenue and reduce profit. The media buyer's job is to find the combination of creative, audience, offer, and landing page that produces contribution strong enough to survive increased spend.
The Core Formulas and Metrics That Actually Matter
Start with two separate calculations because they answer different questions.
ROAS = attributed revenue ÷ ad spend
If Meta attributes revenue to a campaign, divide that revenue by the campaign's ad cost. A result of 2 means the platform reports two units of revenue for each unit spent on ads. For a clear explanation of the calculation and worked examples, use this ROAS formula with examples.
ROI = net profit ÷ total investment
Total investment should include ad spend plus the costs required to create and manage the campaign. Depending on your business, that may include creative production, agency or internal labour, software, fulfilment, payment processing, discounts, refunds, and the cost of goods.
ROAS is useful for daily media decisions because it's quick and comparable. ROI is better for the business decision because it asks whether the complete investment generated profit. A high ROAS can still be unacceptable when gross margin is narrow or fulfilment costs are substantial.
Calculate the break-even point before launch
Your break-even ROAS depends on the margin available to pay for advertising. If only a small part of the selling price remains after variable costs, the campaign needs a higher ROAS to break even. If the offer has a larger contribution margin, a lower ROAS may still leave room for profit.
Build a spreadsheet with these columns:
| Metric | Calculation | Decision use |
|---|---|---|
| Revenue | Attributed sales value | Measures monetisation |
| Ad spend | Meta spend | Measures media investment |
| Contribution profit | Revenue minus variable costs | Shows money available for ads and profit |
| CPA | Ad spend ÷ conversions | Controls acquisition efficiency |
| Contribution after ads | Contribution profit minus ad spend | Determines campaign profitability |
| Customer value | Expected profit from the customer relationship | Supports acquisition decisions |
Don't use customer lifetime value as permission to overspend without evidence. For a subscription or repeat-purchase business, LTV can justify a higher first-order CPA, but only when retention and repeat buying are measured consistently. For a one-purchase product, the first transaction must carry more of the burden.
You should also separate campaign-level ROAS from blended ROAS. Campaign-level reporting helps you allocate spend inside Meta. Blended ROAS compares total revenue with total paid-media spend across channels and can expose cases where platform attribution overstates incremental demand. A separate guide to campaign performance metrics can help you build a wider reporting view without replacing your margin calculation.
Revenue is the input. Contribution after advertising is the decision.
Benchmarking Your Campaigns Against Current Performance Standards
Benchmarks are useful as a starting point, not as a target you can copy into every account. Product margin, purchase intent, sales cycle, geography, creative quality, and audience temperature can move acceptable performance in opposite directions.
A major 2026 Meta advertising benchmark analysed more than 1 million campaigns and reported an average downstream return of $4.13 for every $1 spent. The same benchmark described that figure as 25% higher than the comparable 2022 level, making it a useful historical marker for improving platform optimisation and AI-assisted advertising, not a promise for your account. See the Facebook Ads benchmark analysis for the underlying context.
Another 2025 to 2026 benchmark dataset places typical purchase ROAS around 2.19x to 2.33x, with CPM near $13.50 to $14.20, CTR around 2.19%, traffic CPC around $0.78, and CPA near $38.19. These figures come from broad datasets, so use them to identify an unusual result, not to declare a campaign good or bad. The benchmark details are available in this Facebook Ads performance benchmark report.
Read the funnel as a chain
The most practical way to use those figures is to diagnose the path from impression to profit:
- Start with creative CTR. If people don't stop and click, test the opening visual, promise, proof, angle, or format before changing bids.
- Inspect CPC and CPM together. A high CPC can come from costly impressions, weak click-through, or both. Don't blame targeting until you know which part of the chain is failing.
- Move to conversion rate. Once the ad earns qualified traffic, improve message match, landing-page clarity, checkout friction, and offer strength.
- Check CPA against margin. A lower CPA isn't automatically better if it comes from low-value customers or a weaker conversion event.
- Scale only after the economics hold. ROAS is a useful signal, but contribution after ads is the final gate.
Audience temperature must stay visible. Retargeting can reach 5x to 10x or higher ROAS, while cold acquisition often performs much lower, according to the benchmark overview above. Keep prospecting and retargeting budgets separated so a warm audience doesn't make weak new-customer acquisition look healthy. The Facebook Ads ROAS benchmarks for 2026 provide another reference point for interpreting results by context.
Tagging and Attribution Decisions That Protect Your ROI Calculations
A profitable-looking campaign can be built on broken data. If the browser event fires twice, revenue values are missing, refunds never reach the reporting layer, or UTMs disappear during checkout, your optimisation system receives the wrong feedback.
Set up tracking as an operating process, not a one-time installation. Begin by defining the business event that matters, such as a completed purchase, qualified lead, or paid subscription. Then make sure the event includes the correct value, currency, event name, and order identifier.
Build a clean measurement path
Use a simple audit sequence:
- Name campaigns consistently: Include market, funnel stage, offer, and creative concept in a format your reporting team can filter.
- Add UTMs: Pass source, medium, campaign, ad set, and ad identifiers into analytics and your CRM.
- Deduplicate events: Browser and server-side events need a shared event ID so the same conversion isn't counted twice.
- Reconcile revenue: Compare Meta's attributed sales with payment processor, ecommerce, or CRM revenue. Investigate material gaps rather than accepting either number without scrutiny.
- Record refunds and cancellations: Optimisation based on gross orders can reward ads that acquire customers who later reverse the transaction.
- Check lead quality: For lead campaigns, send downstream qualification or sales outcomes back into the reporting system where possible.
Meta's Pixel can capture browser activity, while the Conversions API adds server-side signals. The technical choice depends on your site, consent setup, CRM, and data maturity. This comparison of Conversions API versus Meta Pixel is a useful reference when deciding how the two should work together.
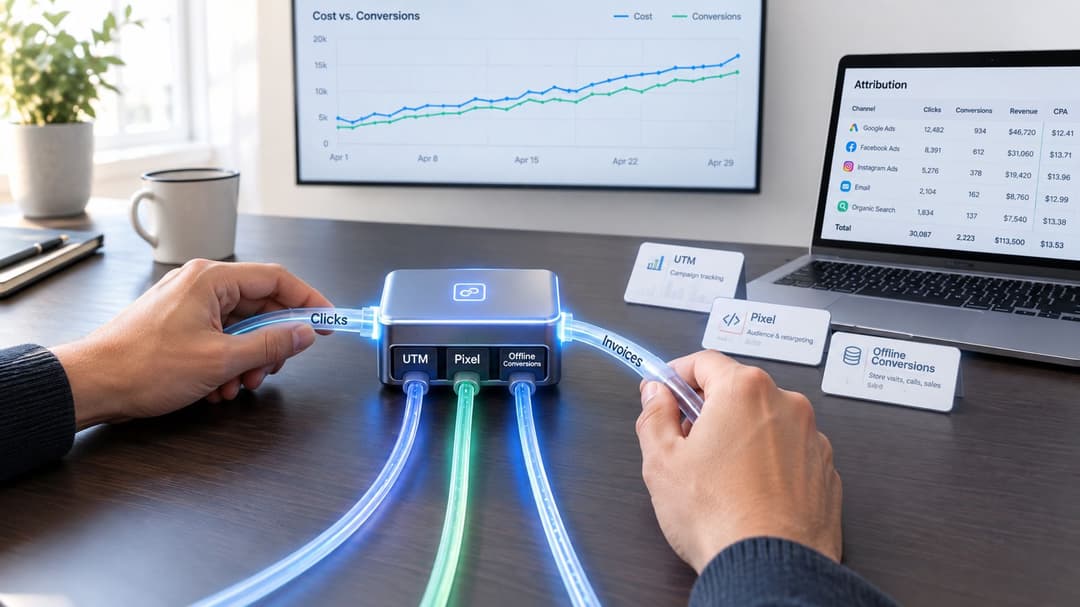
Choose attribution for the decision
Last-click attribution is easy to understand, but it tends to over-credit the final interaction and under-credit earlier discovery. A time-decay model gives more weight to interactions closer to conversion while still recognising earlier touches. Neither model reveals incrementality by itself.
Use platform attribution for delivery and creative comparisons. Use first-party revenue and blended reporting for financial control. For larger budgets, controlled holdouts or geographic tests can help answer whether Meta created additional demand rather than merely claiming demand that would have converted anyway.
Keep a written attribution policy. Define the conversion window, revenue source, refund treatment, and reporting time zone. If the rules change every time performance becomes uncomfortable, the account isn't being optimised. It's being narrated.
When Automation Helps and When Manual Control Still Wins
Automation removes repetitive decisions, but it doesn't remove the need for judgement. Meta's Advantage+ Shopping campaigns delivered an average ROAS of 4.52x, compared with 3.70x for manual campaigns in one 2026 industry benchmark. That result suggests automation can outperform manual structures in the right conditions, but it doesn't prove that every account should hand over every decision. The comparison appears in this 2026 Meta Ads automation benchmark.
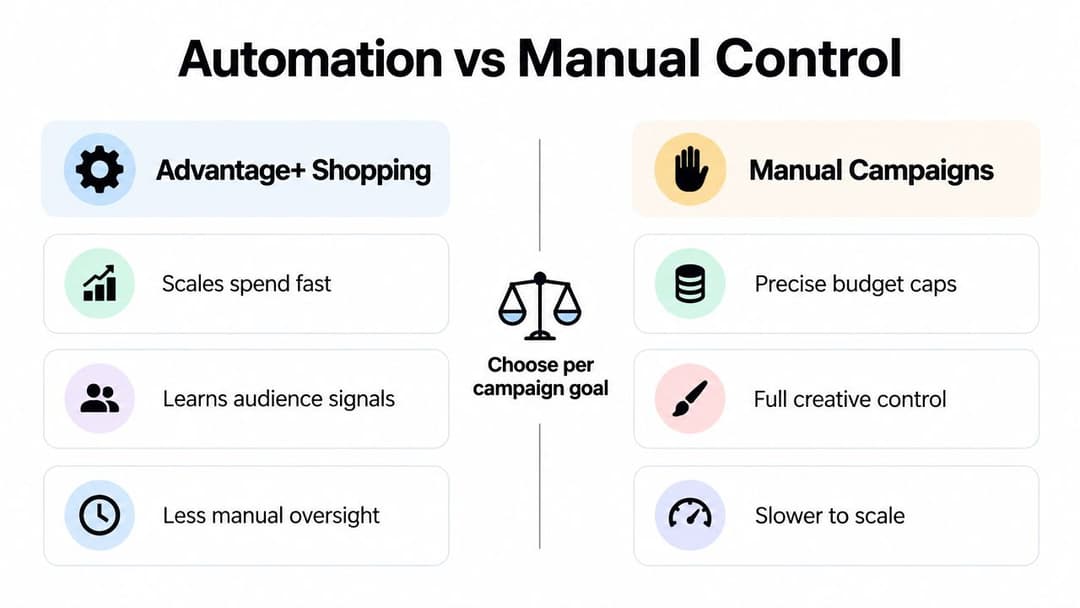
Automation needs fuel
Advantage+ can choose audiences, placements, and creative combinations faster than a buyer working through every variation manually. That advantage becomes meaningful when the account has a clear conversion signal, varied creative assets, enough audience diversity, and a team that can interpret the output.
Automation struggles when the input is thin. If you supply a handful of similar ads, the system has little meaningful variation to test. If the purchase event is noisy or the product has a weak offer, automated delivery can scale an inefficient pattern more quickly.
| Automated structure | Manual structure |
|---|---|
| Useful for broad exploration and efficient delivery | Useful when budget boundaries must stay explicit |
| Benefits from diverse creative and reliable conversion data | Gives tighter control over audience, placement, and spend allocation |
| Can reduce repetitive operational work | Makes controlled diagnosis easier during early testing |
| May concentrate spend into already-winning cohorts | Can protect specific segments from being blended together |
Decide by campaign purpose
Use automation when your priority is finding demand across a broad market and you can provide enough creative variation to support learning. Keep manual control when you need strict budget caps, clean audience separation, regional governance, or a deliberately isolated test.
Manual control still wins when the buyer needs to answer a narrow question, such as whether a specific audience responds to a particular offer. It also helps when unit economics differ sharply between products or markets and blended optimisation would send spend toward revenue that looks attractive but contributes less profit.
Automation is an allocation engine. It isn't a substitute for an offer, a measurement policy, or a creative testing system.
For teams producing many variations, AdStellar AI can generate and organise creative, copy, and audience combinations, connect with Meta ad accounts, and rank performance by measures such as ROAS, CPA, and CTR. That kind of workflow can support either an automated or a manually governed buying structure, depending on how the media team sets campaign rules.
The practical comparison between these approaches is covered in Advantage+ versus manual campaigns. The choice should follow the business constraint, not the appeal of a newer interface.
A Practical Workflow for Testing, Scaling, and Measuring Profit
A repeatable workflow starts before the campaign goes live. Set the contribution threshold, define the conversion event, separate cold and warm audiences, and decide which creative variables you'll test. Without those decisions, the team usually changes several inputs at once and can't explain why performance moved.
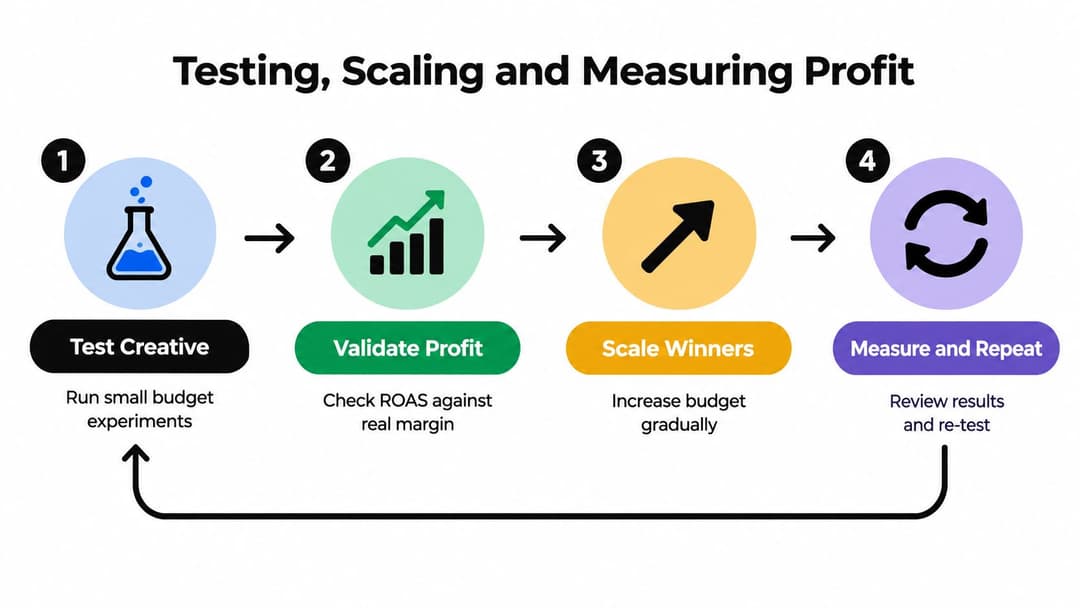
1. Test creative with a clear hypothesis
Don't label ads “Version A” and “Version B” and hope the dashboard reveals a lesson. Name the variable: demonstration versus testimonial, price-led versus outcome-led, founder voice versus customer voice, or static image versus video.
Test enough creative variety to give the delivery system genuine choices. Keep the offer and conversion event stable when you're evaluating the hook. If you change the audience, landing page, offer, and visual together, you may find a winner but you won't know what produced it.
Use the best practices for testing Meta ads to structure experiments around a question rather than random production.
2. Validate profit before increasing spend
A high CTR earns a place in the next review, not an automatic budget increase. Compare the ad's CPA and attributed revenue with contribution margin, refunds, fulfilment, and customer quality. Check cold and retargeting performance independently.
A useful decision sheet can look like this:
| Review question | If the answer is weak |
|---|---|
| Does the creative earn qualified attention? | Change the angle, hook, visual, or proof |
| Does the landing page continue the promise? | Fix message match and conversion friction |
| Does CPA fit contribution economics? | Adjust the offer, funnel, or acquisition target |
| Is revenue quality consistent after the sale? | Reconcile refunds, repeat value, and CRM outcomes |
| Is spend concentrated in one fragile winner? | Add creative and audience diversity |
3. Scale without destroying the signal
Increase budget gradually enough to observe whether the economics persist. Large changes can alter delivery, audience mix, and auction exposure, so judge the new level against the same contribution threshold rather than against yesterday's ROAS.
Scale horizontally by adding credible creative concepts and adjacent audience opportunities. Scale vertically only when the existing campaign can absorb more spend without pushing into lower-quality inventory or exhausting a narrow audience.
4. Measure, document, and repeat
Review performance on a fixed cadence. Record spend, revenue, CPA, contribution after ads, creative concept, audience temperature, and attribution notes. Separate a temporary fluctuation from a repeatable pattern before you make a structural change.
The strongest accounts don't rely on one winning ad forever. They build a loop where customer objections inform new hooks, profitable messages generate fresh variations, and tracking confirms whether platform results match collected revenue. That loop is how you grow ROI for Facebook ads without confusing more activity with more profit.
AdStellar AI helps performance teams create and organise large sets of Meta creative, copy, and audience combinations, then use performance insights to rank them by ROAS, CPA, and CTR. If you want a more repeatable way to connect creative testing with campaign decisions, visit AdStellar AI and review how it fits your current Meta workflow.